
Financial Trading with Deep Learning
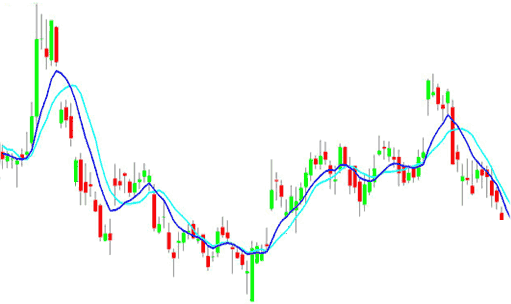
Typically, traders inspect the price movements of a security, derivative, or currency using a candlestick chart (showing the high, low, open, and close market prices for each day). Based on the price movements of the recent past, together with some indicators such as moving averages or RSI, they detect patterns and base their buying and selling decisions on these.
Detecting these patterns automatically has long been a big challenge. This white paper describes a deep learning method to detect chart patterns, such as an up- or downturn, to aid trading decisions or to build algorithmic trading strategies. A recursive neural network (RNN) is trained on historical data with labeled patterns and is then able to automatically identify these within future market moves. The RNN has been tuned and its training optimised for maximum performance on both CPUs and GPUs. As a result, algorithmic trading strategies that behave similarly to a human trader can be built.
- Financial chart pattern recognition
- Deep learning RNN network
- Behaves similarly to a human trader
- Fast training on CPUs or GPUs
- Helps build algorithmic trading strategies
- Support for multiple dimensions or curves